2025 • Self-made project
Building a Profit & Loss Dashboard with AI as a Product Partner
From product concept to live app: how I built a Profit and Loss dashboard using AI, Lovable, and Supabase.
AI-Workflows
UX Design
UI Design
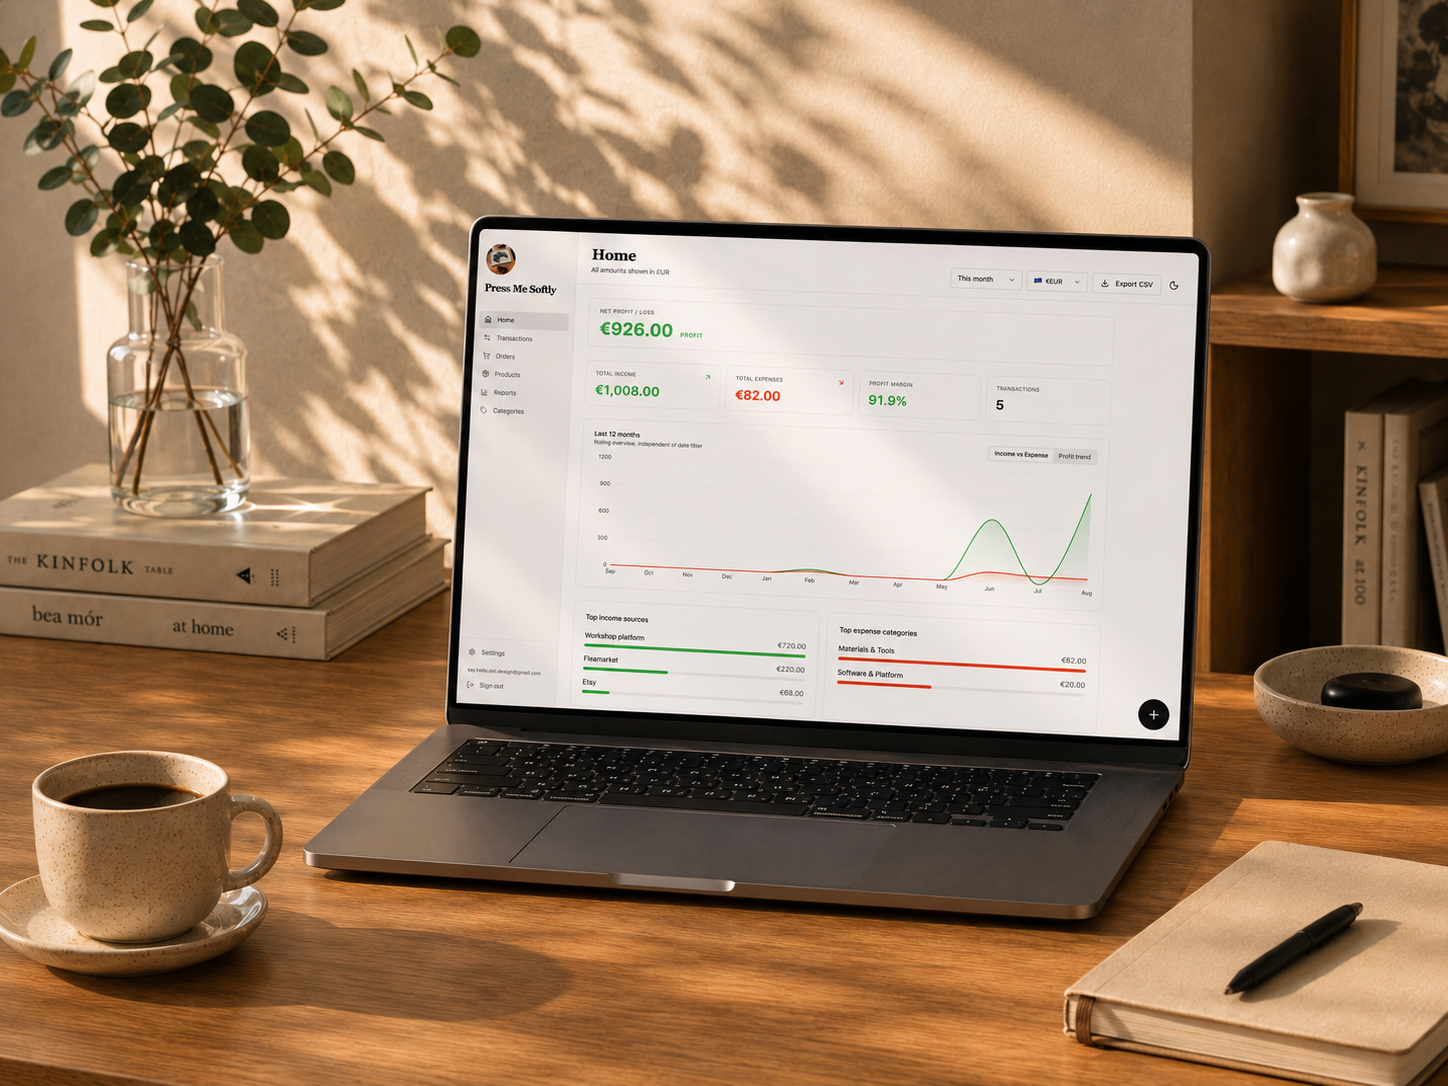
Overview
A real need from a real project
Press Me Softly is my linocut printmaking practice. Early expenses—market fees, tools, paper, and ink—were already coming in, and I needed a simple way to record them before receipts piled up.
Spreadsheets were too easy to neglect, and accounting software felt overly complex for an early-stage studio. Instead, I built a custom Profit & Loss dashboard: a working web app to track income and expenses, organise transactions, and manage multiple currencies.
Role: Product Designer and AI Product Builder
Tools: ChatGPT, Claude, Lovable, Supabase, GitHub, VS Code
Status: Live MVP hosted on Lovable, tracking real studio expenses
The experiment
Testing AI beyond ideation
Having used AI for research and early product thinking, I wanted to see if it could support a much larger part of the workflow. The question:
Could I use AI as a product partner, from the first idea to a working app?
I did not want to stop at generated screens or Figma prototypes. The app needed real user accounts, stored data, calculations, and responsive layouts. As a non-coder, success depended on how effectively I could define the product and guide the tools.
The problem
Financial tracking gets messy quickly
Small creative businesses often start informally. At first, expenses are sparse and there is no income, so financial tracking does not feel urgent. A few months later, there is a pile of receipts, inconsistent categories, and no clear view of profitability.
For the first version, I needed to answer four simple questions:
How much have I spent?
What am I spending money on?
How much income has come in?
Am I making a profit or a loss?
My AI Product Team
Role
Exploring the idea and planning the project
Defining requirements and MVP scope
Turning requirements into build prompts
Building and refining the app
Authentication and data storage
Testing, design direction, and scope decisions
Tools
ChatGPT & Claude
Claude & ChatGPT
Claude
Lovable
Supabase
Me
Process
1. Setting the direction
I started by describing Press Me Softly, the financial problem, and the tool I wanted to build. ChatGPT and Claude helped me break the project into four broad stages:
Define → Design → Build → Deploy
The conversations were open-ended, helping me compare approaches, question unnecessary features, and lock down a realistic MVP scope.
2. Turning the idea into a PRD
Before opening Lovable, I worked with Claude and ChatGPT to create a Product Requirements Document (PRD) covering the core problem, functional requirements, and future roadmaps.
This provided a stable foundation. Rather than asking Lovable to “make a finance dashboard,” I could specify exactly what the product needed to do—and what it should exclude.
3. Architecting the database with Supabase
Lovable builds frontend UI quickly, but features like user accounts, filtering, and live calculations require a secure backend database.
To bridge this gap, I used Claude to translate the PRD into a complete database setup in Supabase. Together, we designed the core data structure, generated setup scripts, and configured Row Level Security so users can only access their own records.
Setting up Supabase first gave Lovable a solid backbone. The tool didn't have to guess how data was connected—it simply read and wrote to a clear, working structure.
4. Turning requirements into Lovable prompts
Once requirements were clear, I used Claude to write structured prompts for Lovable. I never attempted to generate the entire product with one prompt.
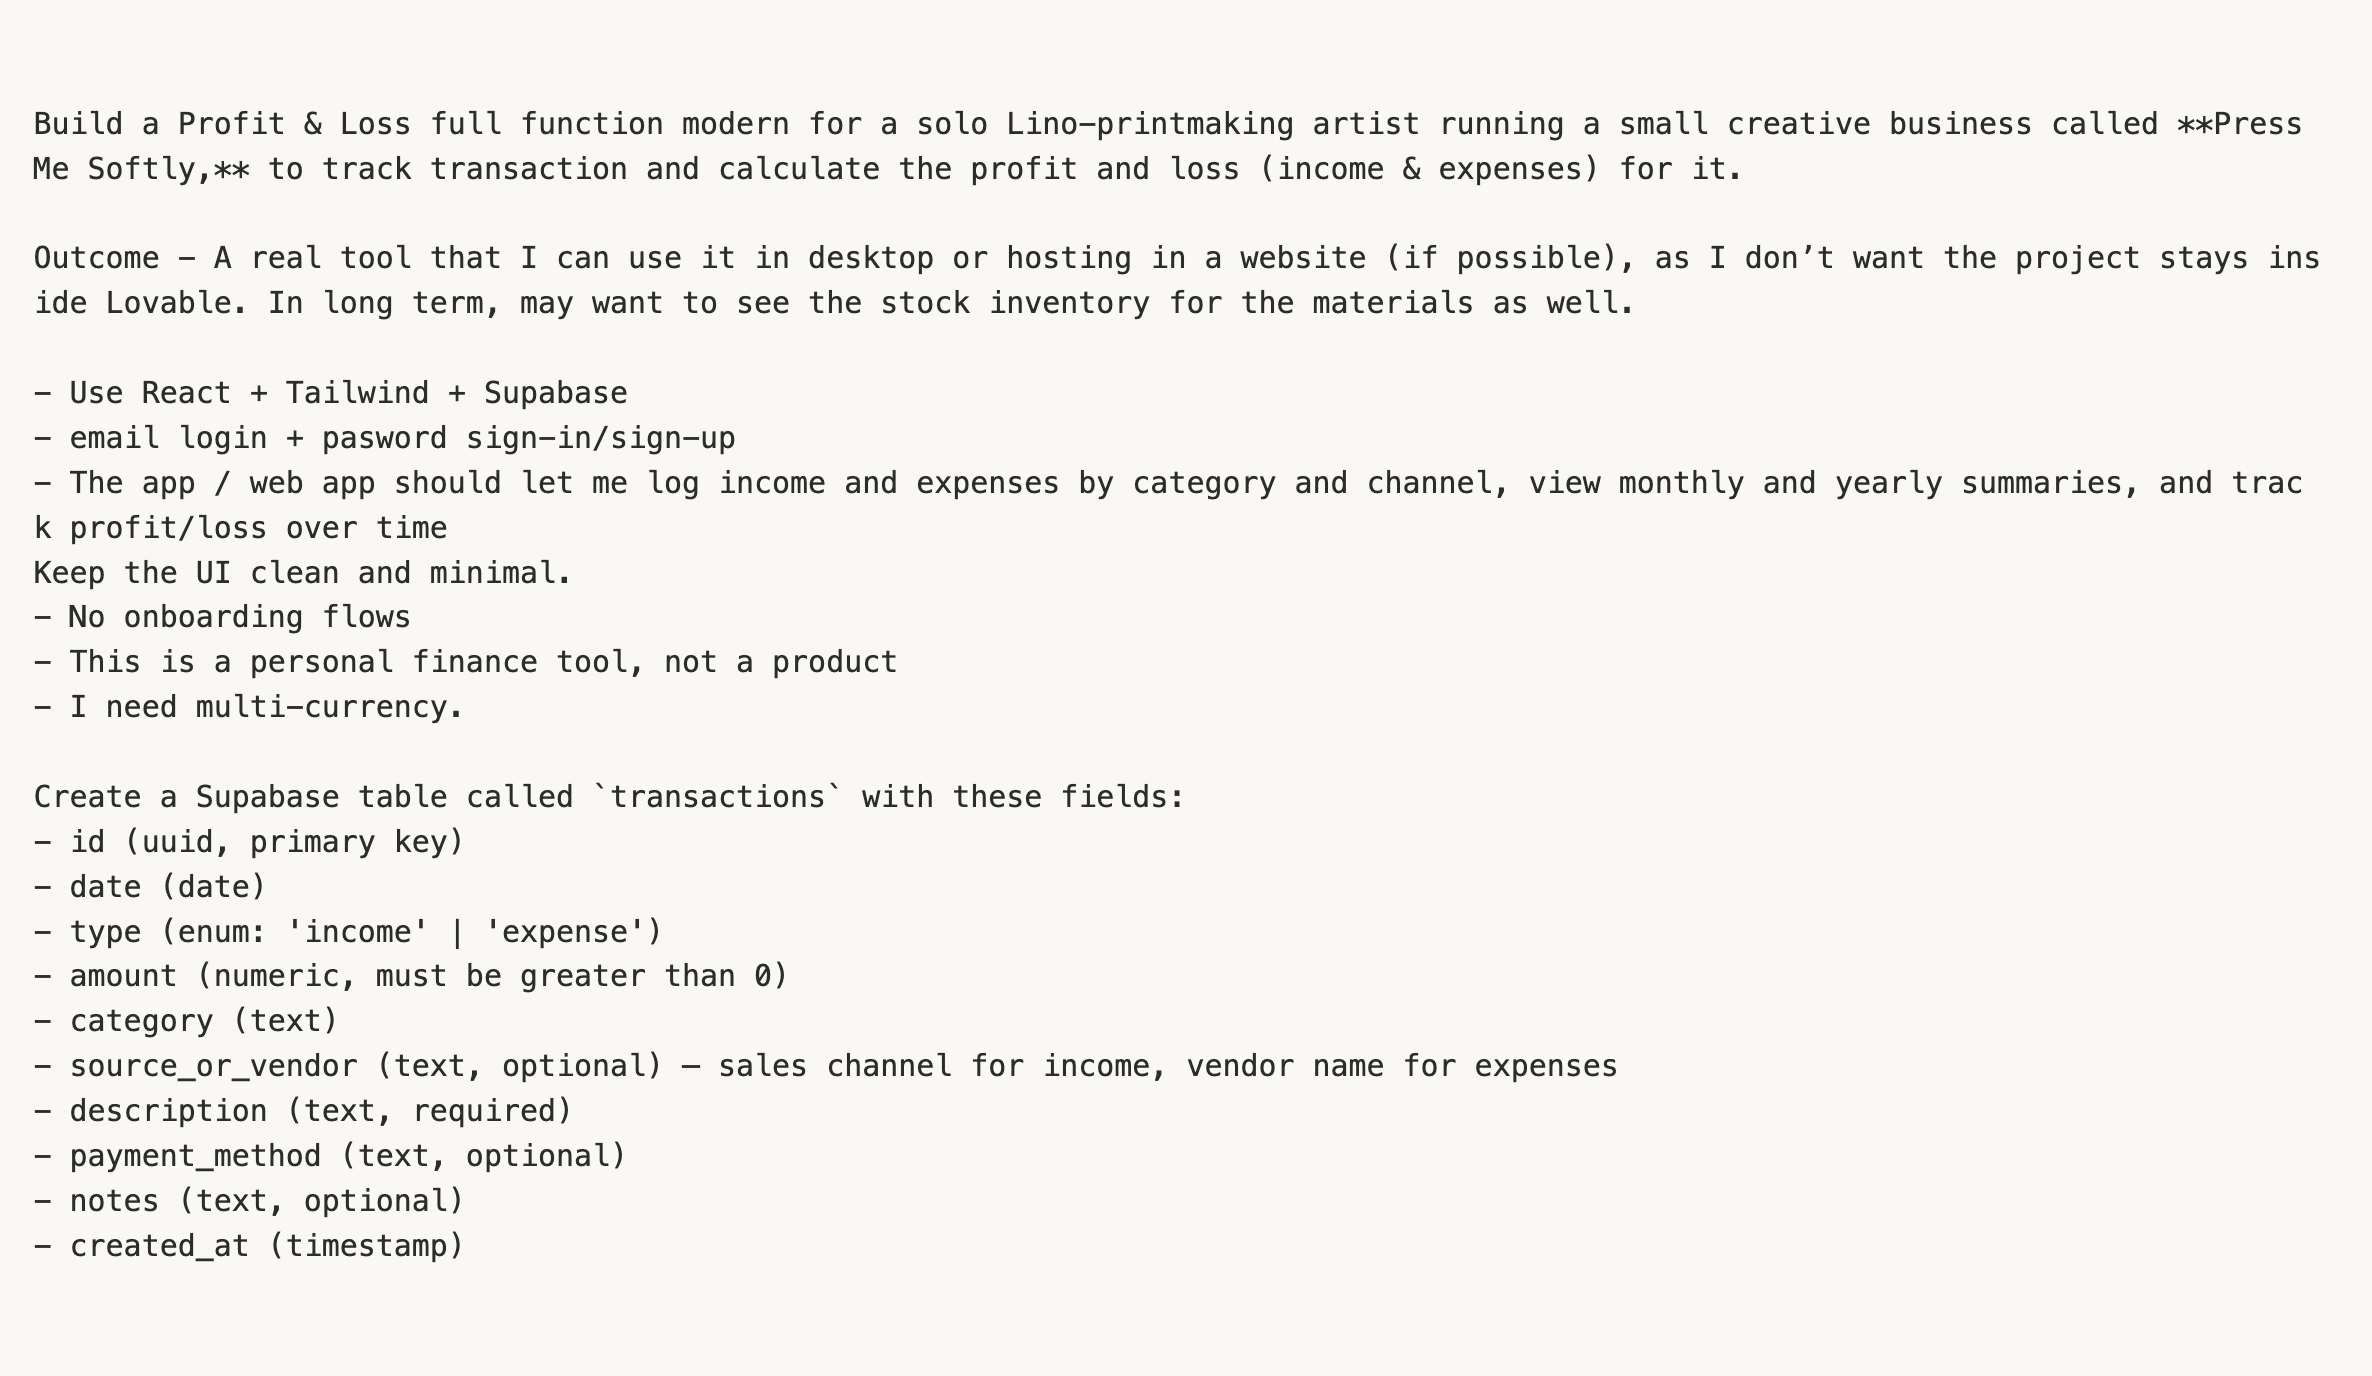
The foundation: The initial prompt established business context, tech stack, and core data structures.
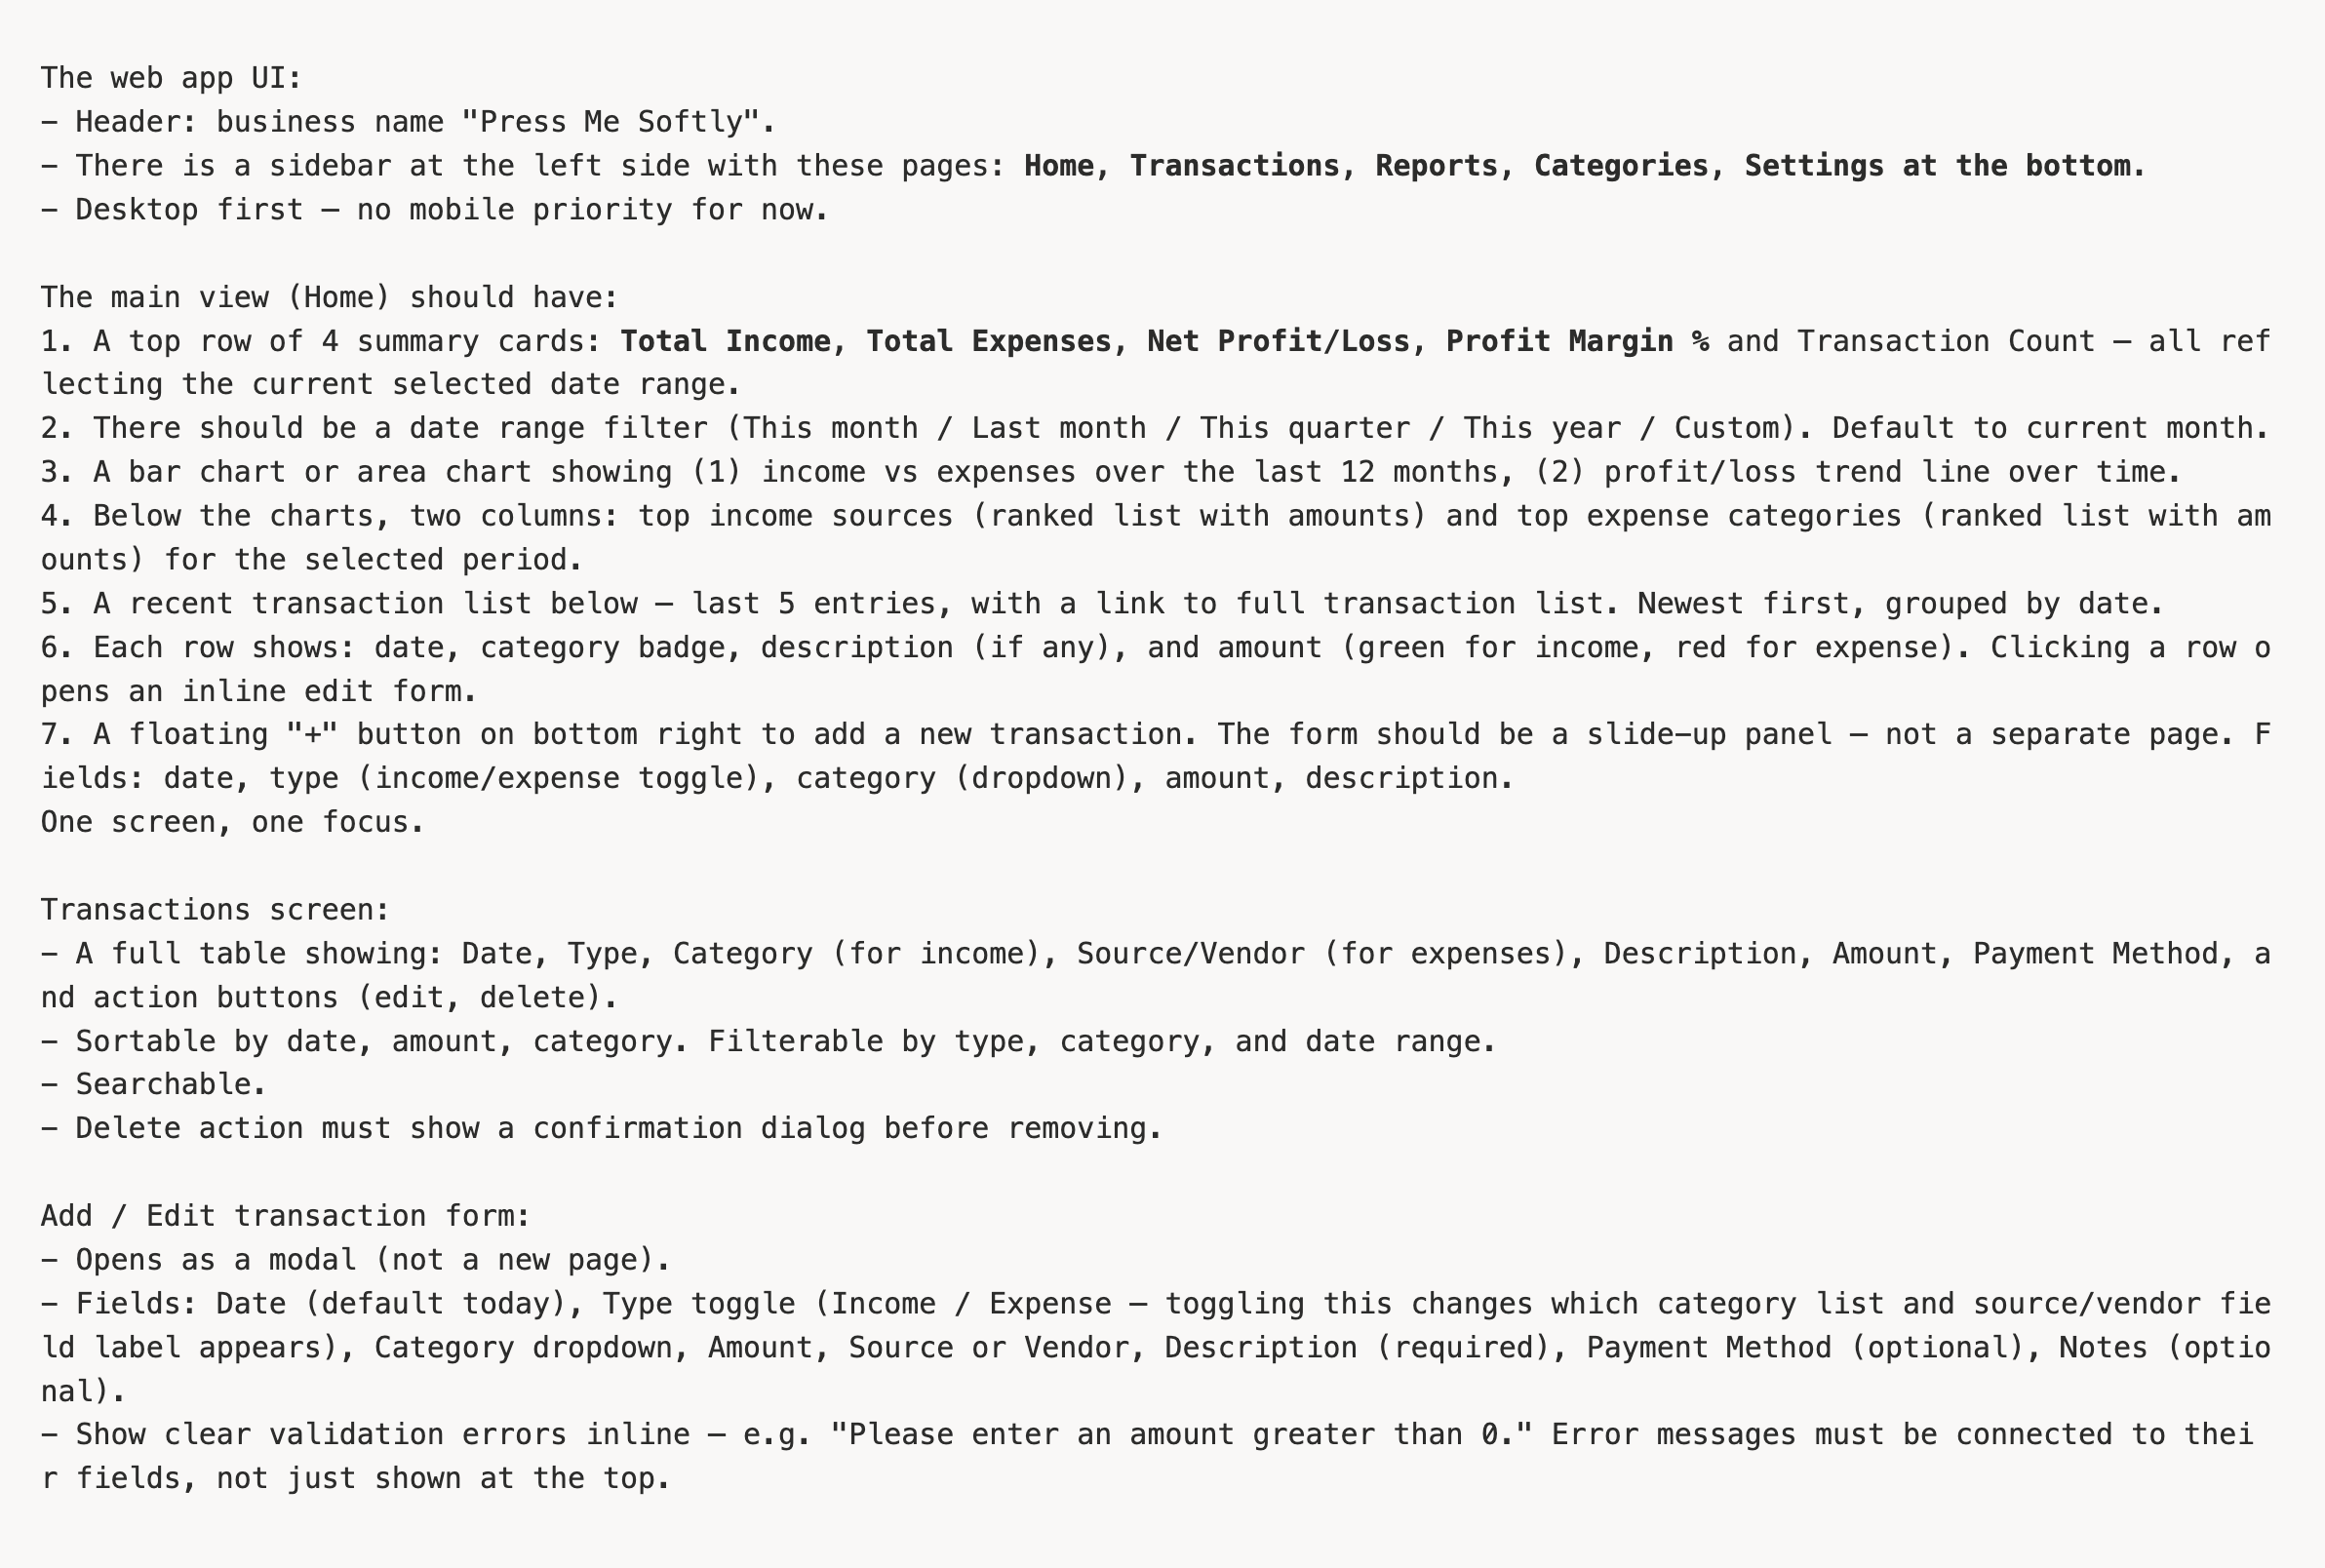
The main layout: Subsequent prompts defined application structure, navigation, and core views.
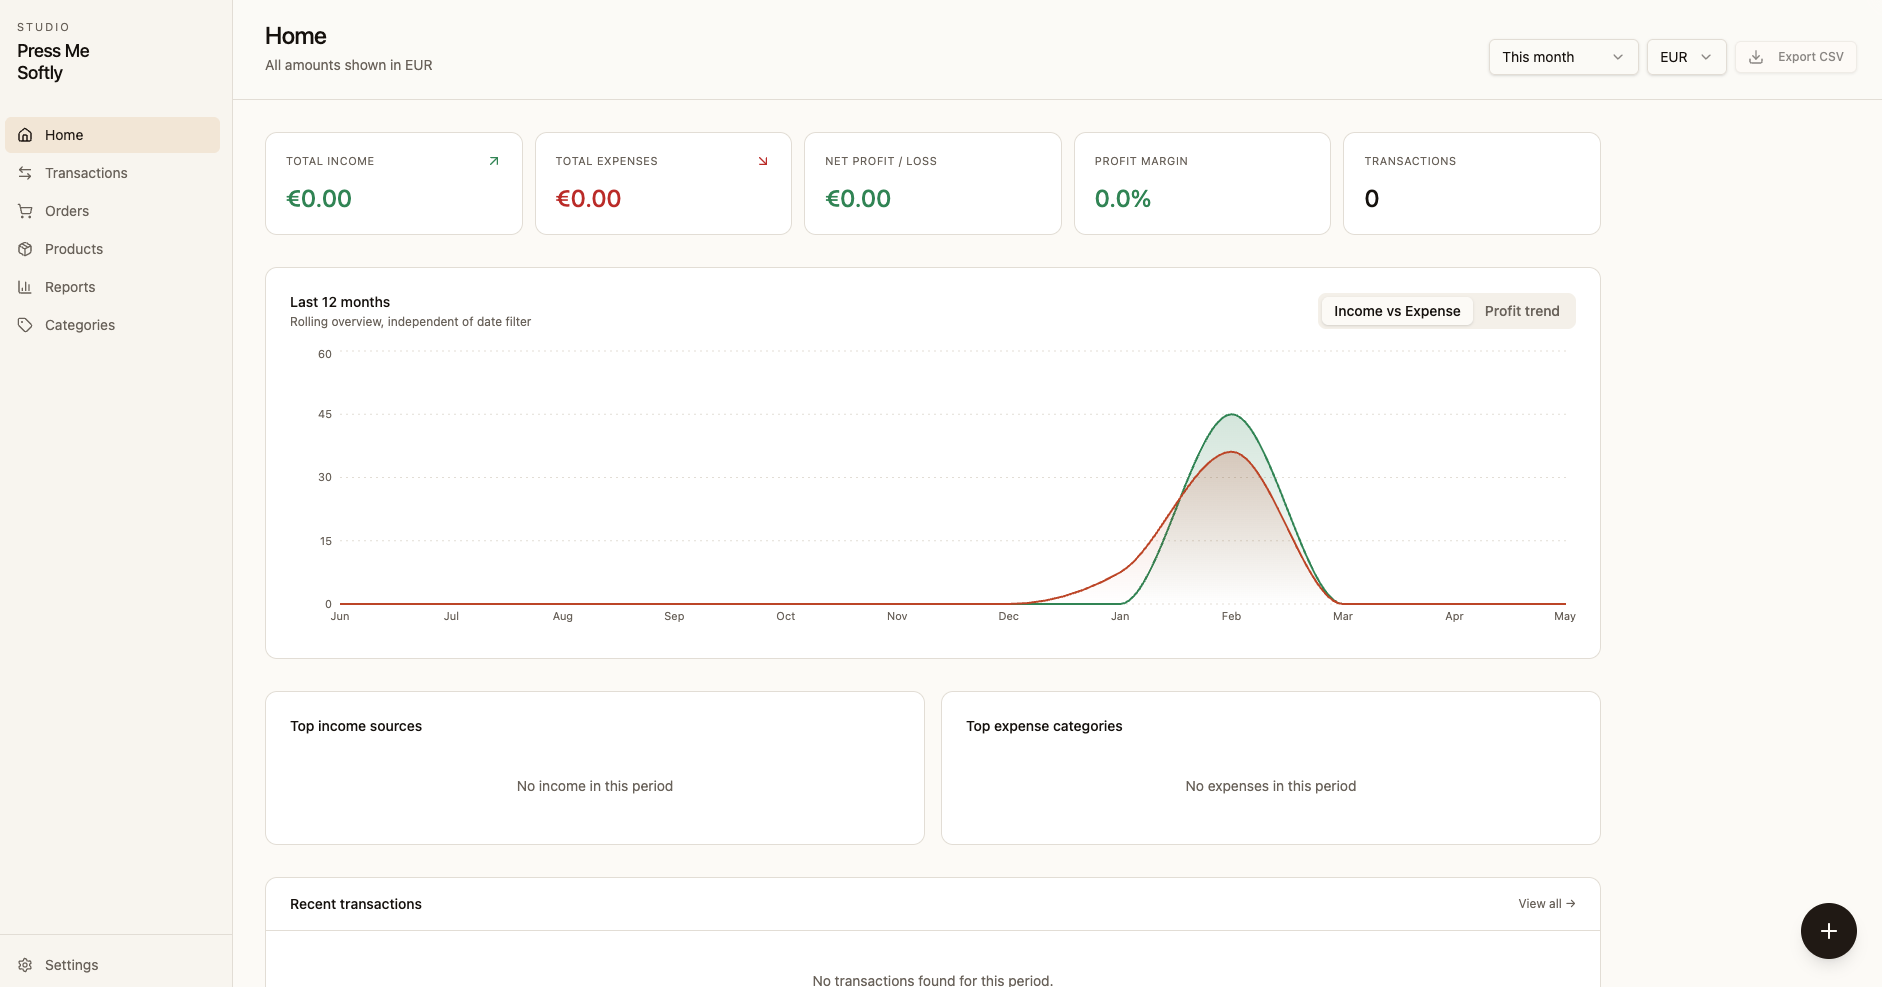
Lovable produced the first version quickly. Common UI patterns — sidebars, cards, tables, and slide-out forms — were immediately functional.
5. Moving from broad prompts to precise corrections
Early prompts described entire pages. As the app matured, I shifted to targeting single rules or behaviours at a time.
For example, Lovable initially assigned category colours randomly. I defined a fixed palette and logic system so badge colours remained consistent and visually signified data types across all screens.


6. Uncovering functional issues beyond the visual layer
Before polishing visual details, I needed to ensure core application logic worked under real conditions.
Many issues weren't visible in static screenshots. They only surfaced through manual testing—entering sample transactions, testing multi-currency conversions, checking global calculations, and scaling browser windows across devices. In several cases, interfaces looked complete, but underlying rules broke during interaction.
Testing as an active user helped me identify system-wide logic flaws early, using Claude to refine underlying rules before returning to Lovable for UI adjustments.
How my role changed during the project
At first, I focused on defining the problem, scoping the product, and refining the PRD by removing non-essential features. Once building began, my focus shifted to continuous testing—entering sample data, testing edge cases, and checking responsive layouts.
My main responsibility became orchestration: deciding whether to prompt Lovable directly for simple UI changes or return to Claude for logic updates. Rather than writing code manually, I defined requirements, reviewed generated outputs, and directed corrections.
The multi-tool workflow loop
Building the dashboard was an iterative loop across Claude ↔ Supabase ↔ Lovable.
For complex issues or global logic—such as calculation rules or currency handling—I returned to Claude first. Once logic was finalized, I updated Supabase as needed, then executed the changes in Lovable. After core functionality was working, I tweaked UI spacing, hierarchy, and badge styles directly in Lovable.
Deploying the live app
Once core features and layouts aligned, I published the dashboard through Lovable. Hosting the live MVP on Lovable provided an immediate web app accessible on any device to log real studio expenses on the fly.
What I learned
A clear PRD turns vague prompts into technical specs: Prompting works best when product decisions are already made. Mini-specs outlining explicit rules, edge cases, and expected states prevented mid-build guesswork.
Managing AI requires orchestrating tools: No single tool handled the full project. Claude excelled at logic, database design, and troubleshooting, while Lovable excelled at rapid UI generation.
Polished UI can mask functional bugs: AI builds screens that look finished instantly. Currency conversions and layouts appeared fine visually but failed during actual use, shifting the designer's primary job to rigorous functional testing.
What’s next
The dashboard is currently used to track studio expenses across EUR and HKD. Next iterations will explore:
CSV imports for Etsy and Shopify sales
Profit breakdowns by artwork and sales channel
Automated financial summaries
This project proved AI can support far more than visual UI drafts—acting as a full partner in planning, backend structuring, building, and troubleshooting when guided with clear context and oversight.